
The Conservancy Initiative has compiled the Odor Complaint Data and presents the data in a series of graphs updated periodically. To read the latest article describing the Odor Scorecard click here.
If there is another graph you would like to see please let us know.
Scroll Down to View Charts
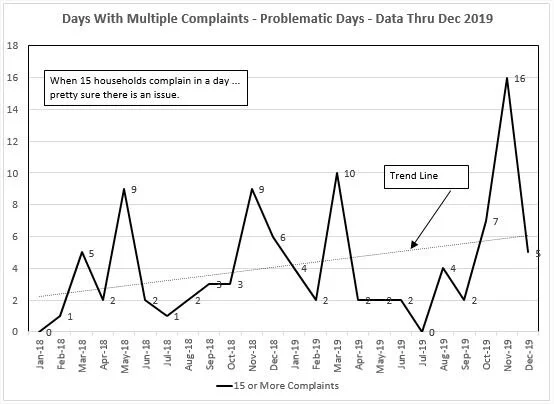
Problematic days
If there are 15 or more odor complaints on the same day … the odor is real! Half the month of November had significant odors. Notice the increasing (bad news) trend.

review of ads’s response to recent odor violations
This chart is complicated but it demonstrates that ADS does not appear committed to solving odor issues. This appear to be doing the minimum to satisfy EGLE.