
The Conservancy Initiative has compiled the Odor Complaint Data and presents the data in a series of graphs updated periodically. To read the latest article describing the Odor Scorecard click here.
If there is another graph you would like to see please let us know.
Scroll Down to View Charts

Odor complaints by month
The landfill’s performance has been fairly consistent with 105 odor conpliants in May. Waste shipments received at landfill are believed to be significantly reduced during the ‘Stay at Home Executive Orders’. Why haven’t odors decreased?
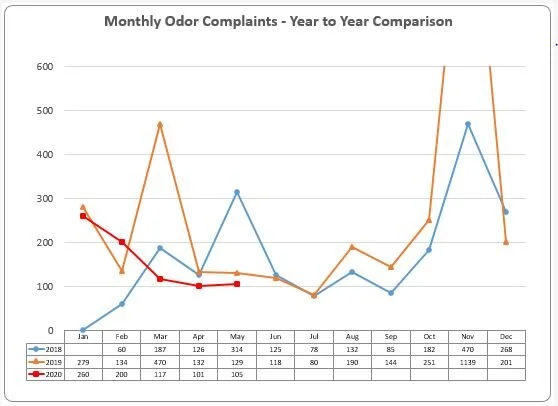
2019,2019 and 2020 compared
This chart shows the smelliest time of year is the fall. Summers months have the least odors.